
new 3/6/03, special thanks to "Da Mystery Guy" for his contributions.
I have about 60 new reported cases of cam failures since the last statistical summery. I now have 187 reports with some mileage information. Average miles to failure was70k, then 75k is now 76,191k with a Std Dev of +/- 24,815k so anything over 50 your at prime risk territory.
More alarming, 11 cases at or under 45k, 15 cases 45k-50k so I would just about weld the cams on a new V8SHO engine.
| Name | Miles |
| Trent & Lisa Bowen | 22,000 |
| Jeffrey Glovier | 24,439 |
| G Blizman | 25,000 |
| Ray Finley | 31,223 |
| Jeff Johnson | 39,233 |
| Sprague Fleming | 39,544 |
| Scott Wilson | 41,000 |
| Sutton | 41,000 |
| William & Jenny Ordean | 42,000 |
| William Ordean | 42,000 |
| Dennis Rodkey | 45,000 |
Complete frequency table looks like this:
| Less than | Count |
| 25k | 3 |
| 30k | 0 |
| 35k | 1 |
| 40k | 2 |
| 45k | 5 |
| 50k | 15 |
| 55k | 14 |
| 60k | 18 |
| 65k | 14 |
| 70k | 19 |
| 75k | 9 |
| 80k | 14 |
| 85k | 10 |
| 90k | 15 |
| 95k | 9 |
| 100k | 11 |
| 105k | 8 |
| 110k | 3 |
| 115k | 2 |
| 120k | 4 |
| 125k | 2 |
| 130k | 2 |
| 135k | 4 |
| 140k | 0 |
| 145k | 1 |
| 150k | 2 |
It charts like this:
www.shoforum.com has a thread which V8SHO has the most miles, no welds or pins. If a car can go 150k before a cam failure then I don't know what to conclude. Will all cars have a cam failure in time? I don't know.
187 reports is not a small sample size, we should be approaching some statistical meaningfulness. Most drivers average 12k-15k per year. Based on current info less then 300 owners have welded or pinned their cams. I don't know the effect that would have except those cams should never fail.
I don't think this is a normal distribution but a "T" distribution. I forgot all my Graduate level math. any Stat wizards on the list who can help me?
Buford
 |
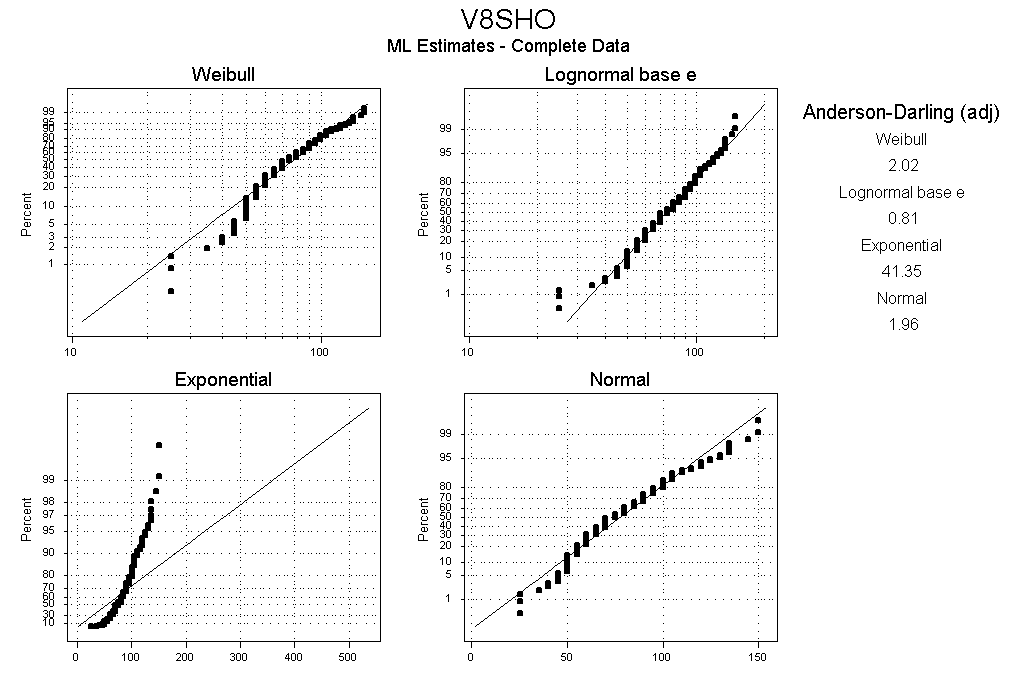 |
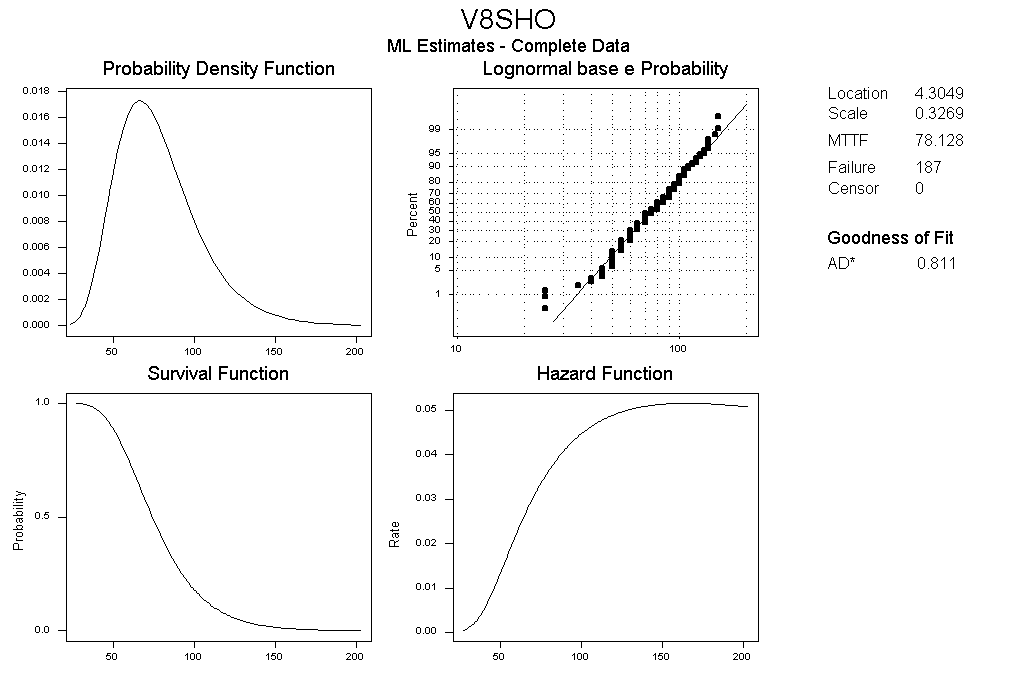
I ran the stats and it looks like a lognormal base e distribution. I ran a the following tests Weibull, Lognormal base e Exponential and Normal (no t distribution). I have included a graph of the test that I used to determine to use the lognormal and the reliability /survival plots run with the lognormal plot.
Just a short explanation of the reliability/survival chart, the key number to look at is MTTF (Mean Time To Failure ), the chart I sent you had a MTTF of 78.128K miles.
MTTF is a basic measure of reliability for non-repairable systems. It is the mean time expected until the first failure of a piece of equipment. MTTF is a statistical value and is meant to be the mean over a long period of time and large number of units. For constant failure rate systems, MTTF is the inverse of the failure rate. If failure rate is in failures/million hours, MTTF = 1,000,000 / Failure Rate for components with exponential distributions.
Technically MTBF (Mean Time Between Failures) should be used only in reference to repairable items, while MTTF should be used for non-repairable items. However, MTBF is commonly used for both repairable and non-repairable items.
I would have to say that a cam is a non-repairable item, in that you should not have to repair it over the life of the vehicle.
The chart only includes data that was on your website, and therefore may be skewed, in that I am unable to include all of the data (all of the non-failures and failures that we do not know of) and that might skew it to another direction, but you work with what you have. Hope this helps you out.
Da Mystery Guy
(thanks Mystery Guy)
Just a short explanation of the reliability/survival chart, the key number to look at is MTTF (Mean Time To Failure ), the chart I sent you had a MTTF of 78.128K miles, I re-ran the numbers with all of the data and the MTTF moved to 76.380K miles, but the curve was a better fit (Anderson-Darling - lower is better).
What this tells me is based upon this data, the cam will last about 75K miles, it may last longer, but I would not bet on it. I have included some of the other data from the run. The Table of Percentiles gives a general idea what percentage of parts will fail at what mileage, depending on the type of curve you fit the data too.
The most important plot to look at is the MTTF, this gives a good idea of when the part will fail. If you have all of the information (as I'm sure that someone at Ford's does), you could predict the life of this cam very accurately using basic statistical tools.
I am not an expert at doing this, I just took some classes during my masters program and use a statistical package at work to perform DOE's (design of experiments) and fatigue prediction with FEA (finite element analysis).
Distribution ID Plot
Variable: Miles
Goodness of Fit
Distribution Anderson-Darling (adj)
Weibull
1.533
Lognormal base e 0.502
Exponential 40.282
Normal
1.507
Table of Percentiles
Standard 95% Normal CI
Distribution Percent Percentile Error
Lower Upper
Weibull 1
20780.3 1811.51 17516.5
24652.1
Lognormal base e 1 32944.9
1563.19 30019.3 36155.7
Exponential 1
765.8 56.00 663.5
883.8
Normal 1
18617.6 3484.01 11789.1
25446.2
Weibull 5
34220.3 2100.47 30341.4
38595.0
Lognormal base e 5 41451.9
1567.14 38491.4 44640.1
Exponential 5
3908.1 285.79 3386.3
4510.4
Normal 5
35483.7 2776.00 30042.8
40924.5
Weibull 10
42653.4 2150.88 38639.4
47084.4
Lognormal base e 10 46851.6
1558.38 43894.7 50007.7
Exponential 10
8027.6 587.03 6955.7
9264.7
Normal 10
44474.9 2442.35 39688.0
49261.8
Weibull 50
75915.6 1998.79 72097.4
79936.0
Lognormal base e 50 72163.2
1778.64 68760.0 75734.9
Exponential 50
52811.9 3861.99 45760.0
60950.6
Normal 50
76191.5 1809.80 72644.4
79738.6
Table of MTTF
Standard 95% Normal CI
Distribution Mean
Error Lower
Upper
Weibull
76142.9 1881.51 72543.1 79921.3
Lognormal base e 76380.8 1935.32 72680.3
80269.7
Exponential 76191.5 5571.67
66017.7 87933.1
Normal
76191.5 1809.80 72644.4 79738.6
Da Mystery Guy
(thanks Mystery Guy)